VOC Technical Services

Our clients' projects and goals are our top priority. Every project comes with a 100% guarantee that the service will be efficient, timely and cost-effective.

View our services timeline here.
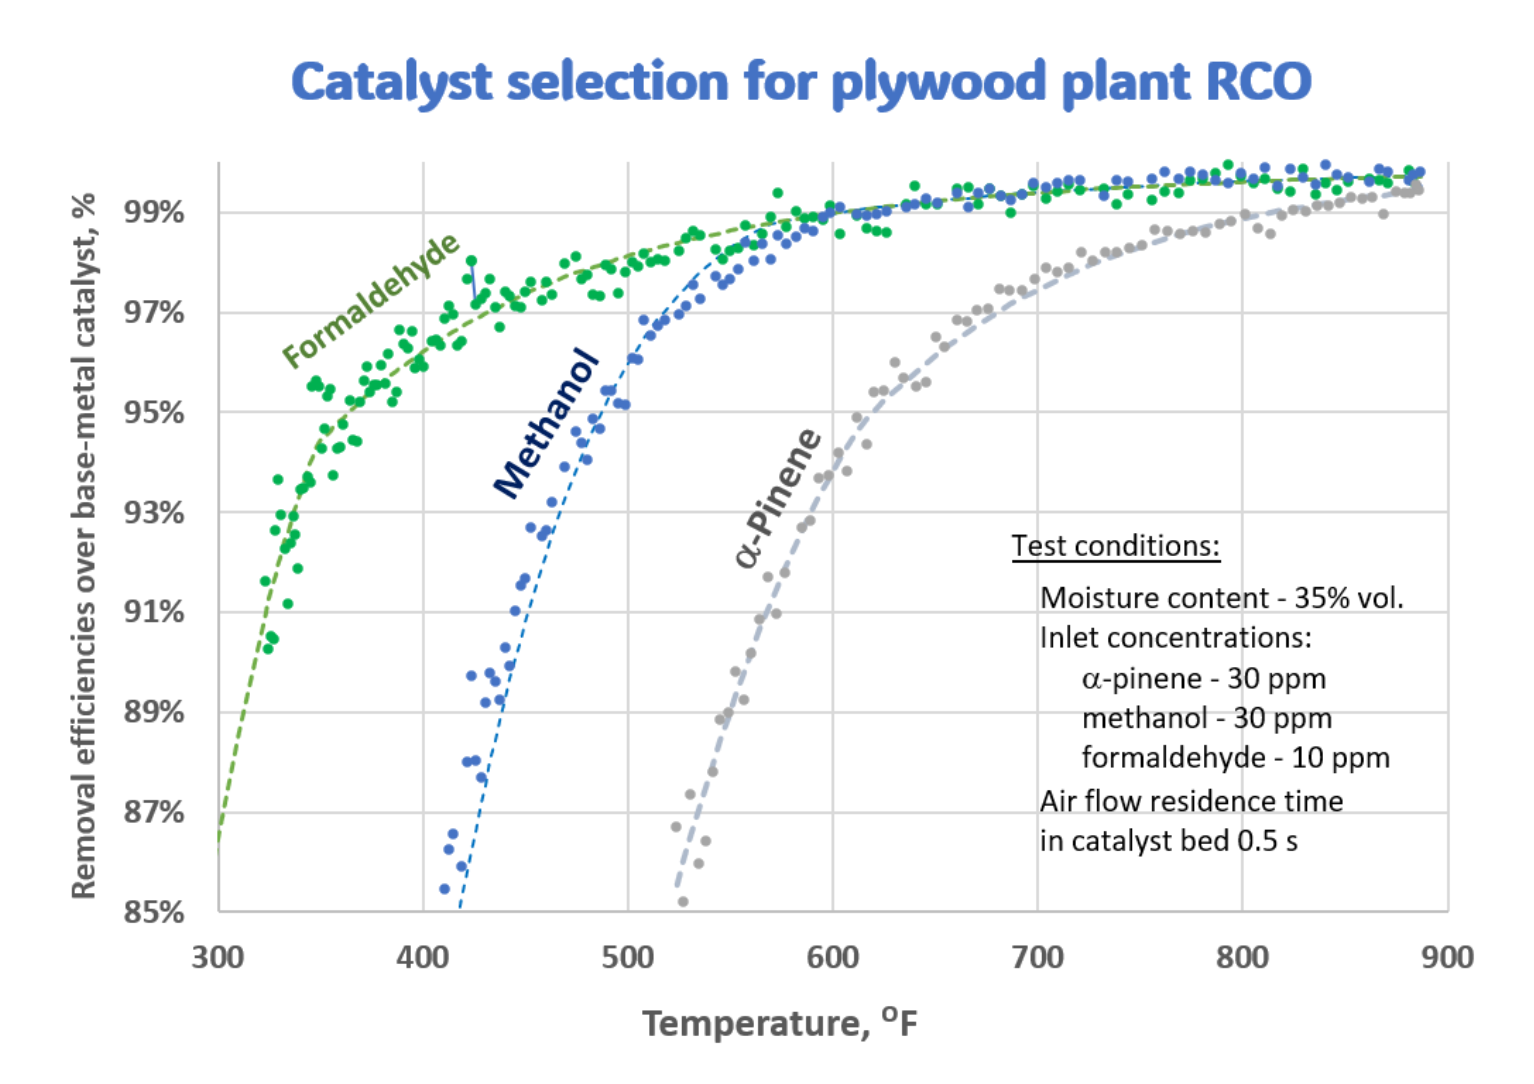
Catalyst selection graph for a plywood plant RCO showing removal efficiency by temperature
This example provides test results obtained with tubular reactor in course of catalyst selection for VOCs and HAPs emission control after plywood manufacturing. The tests involved passing through catalyst bed synthetic mixtures of highly humidified air containing major terpenoid VOC – α-pinene, and major HAPs – methanol and formaldehyde. The process air conditions such as contents of moistures and organic compounds mimic actual operation. The dotted curves show the test data processing with mathematical model enabling catalyst design evaluation.
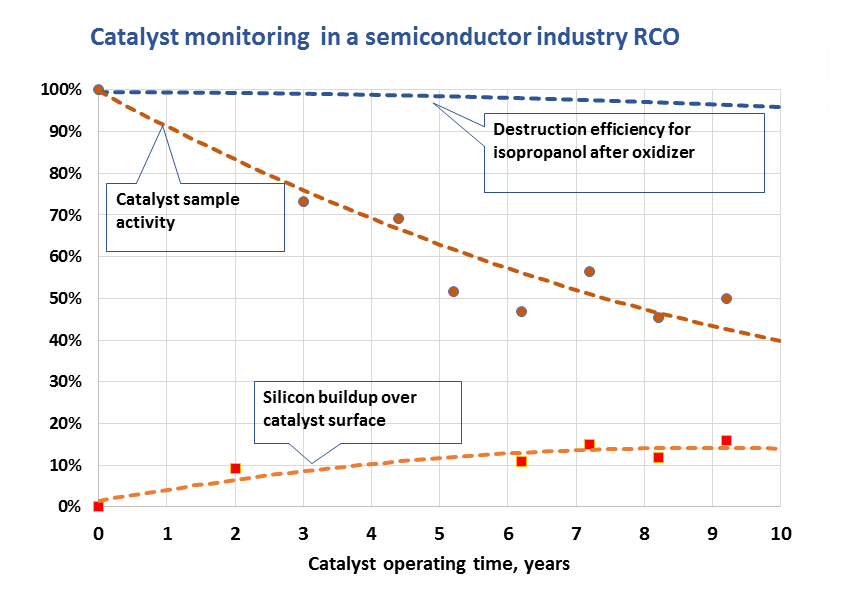
Catalyst monitoring in a semiconductor industry RCO — chart showing catalyst activity decay and silicon buildup over 10 years alongside destruction efficiency
In this example, the squares and circles show catalyst activity and silicon concentration results for samples collected from the oxidizer during a 10-year long operating span. The oxidizer mathematical model incorporates the test results that enables prediction of the VOC destruction efficiency (upper curve). We are happy to advise if and how to correct the oxidizer operating parameters for meeting air pollution control requirements.

DISCUSS YOUR PROJECT

Contact our engineering team to discuss your specific needs and learn how Matros Technologies can help you achieve reliable, cost-effective VOC emission control.

Contact Us